How you interpret charts is often determined by your underlying bullish or bearish bias. Here’s one way the bear market charts can be interpreted both bullish and bearish.
If you’re bullish…
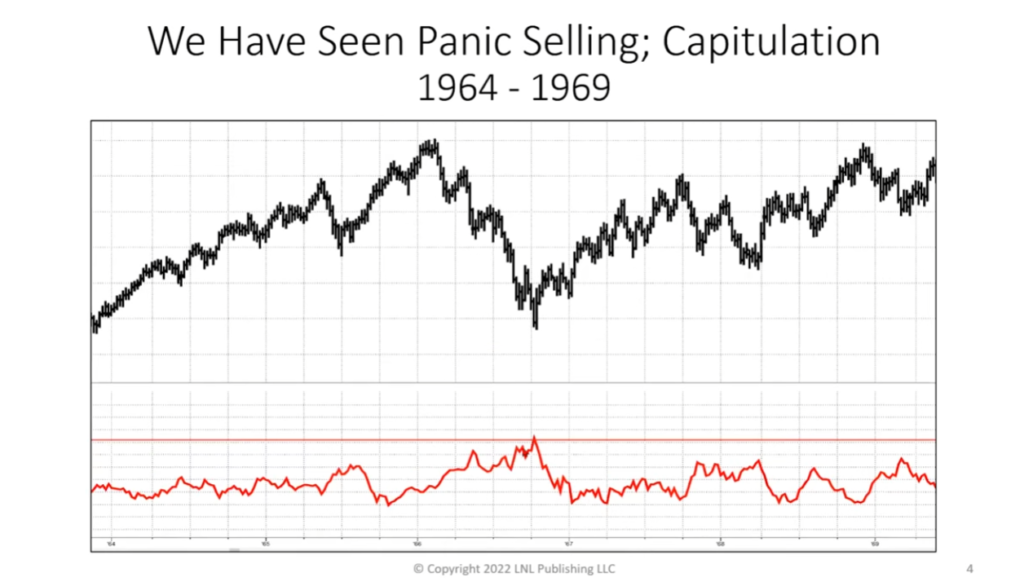
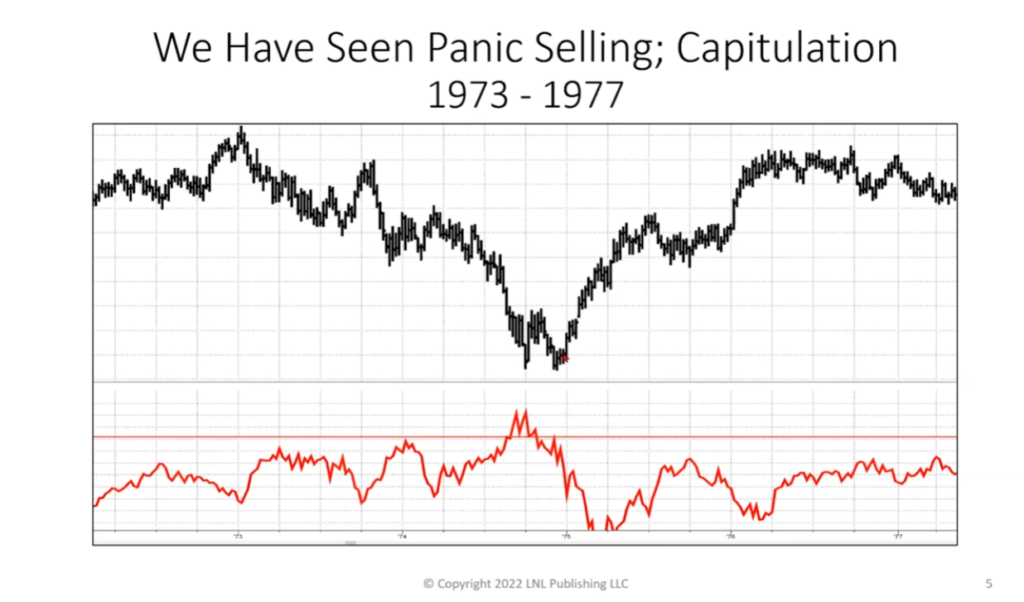
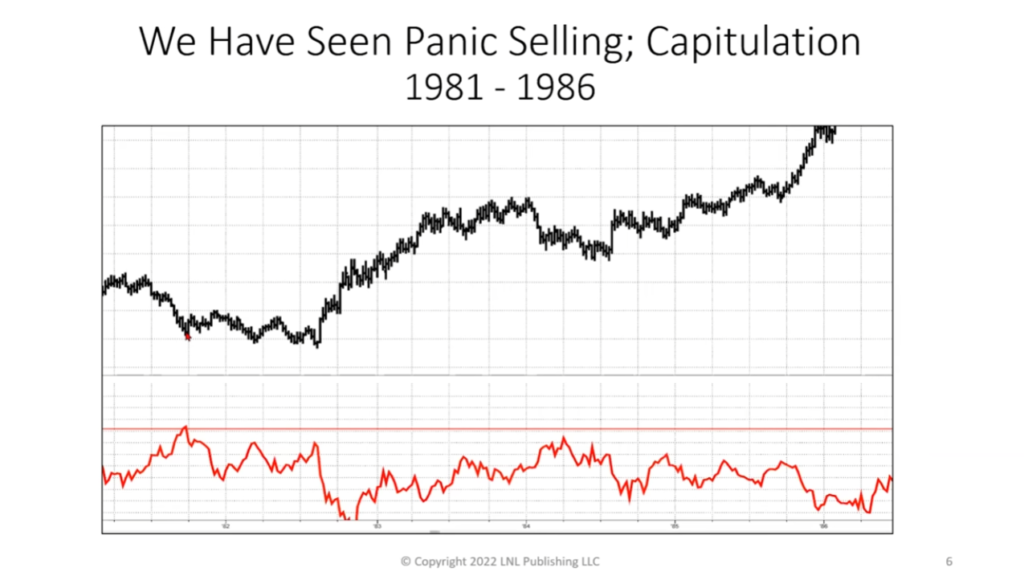
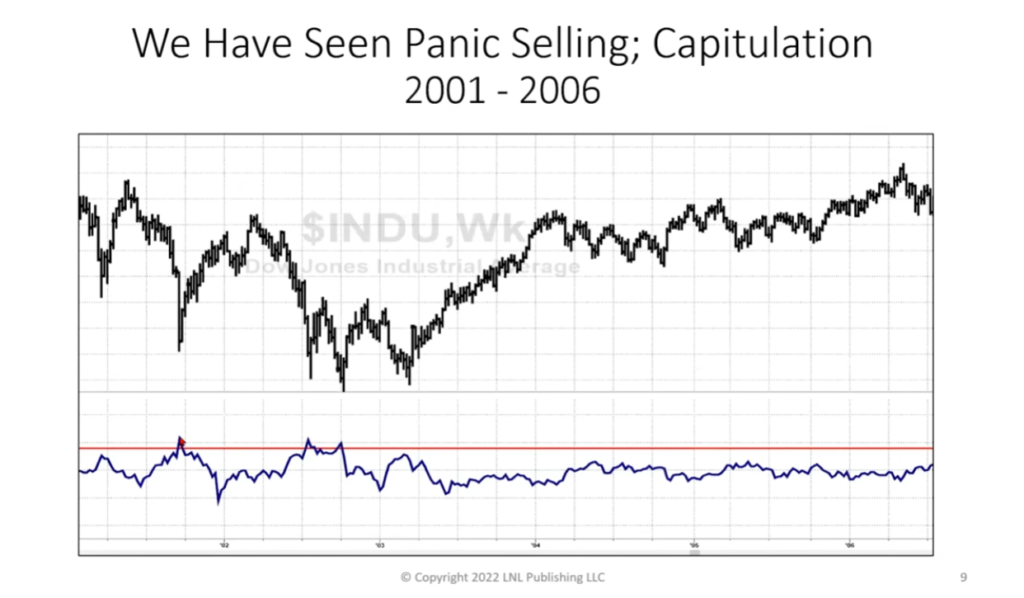
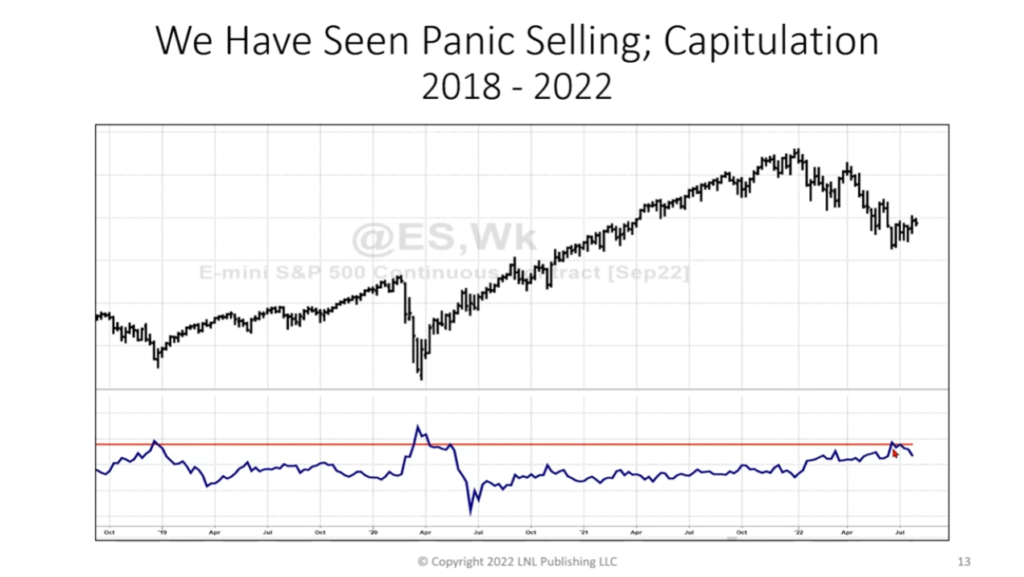
The great Larry Williams turned bullish on the S&P 500 based on the fact that we’ve seen 1) a capitulation low and 2) a subsequent surge in breadth.
He compares this low to the prior bear market capitulation lows like 1968, 1974, 1982, 2001, and 2008. He points out that all major lows have accompanied a surge in his “capitulation indicator.” Any time the capitulation indicator goes above the red line, it’s an indication that traders have panicked. I don’t know what the indicator measures but you can substitute a volume-based indicator such as the Chaikin Money Flow to get similar signals.
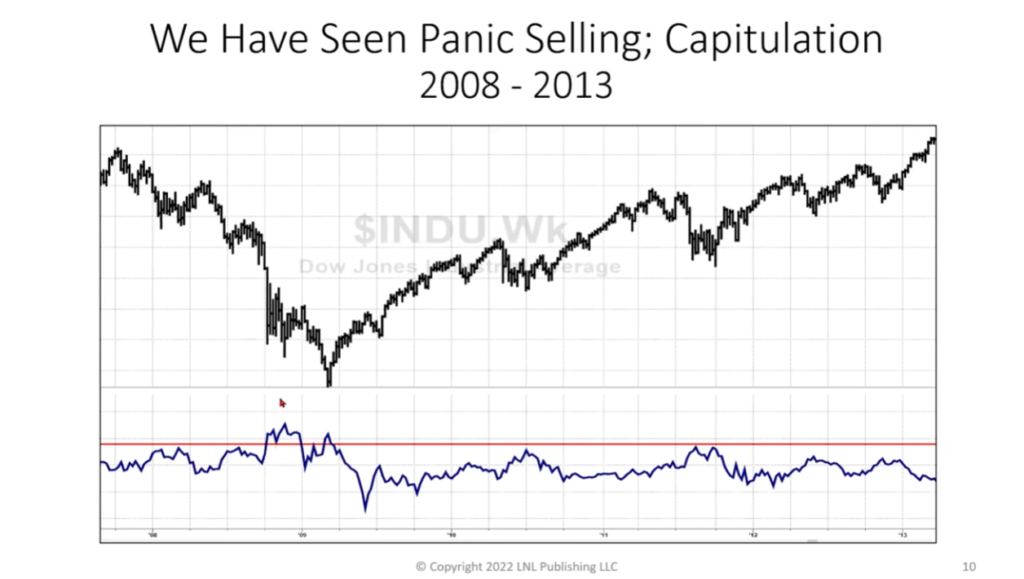
Larry points out that the capitulation indicator reached a critical level several weeks ago.
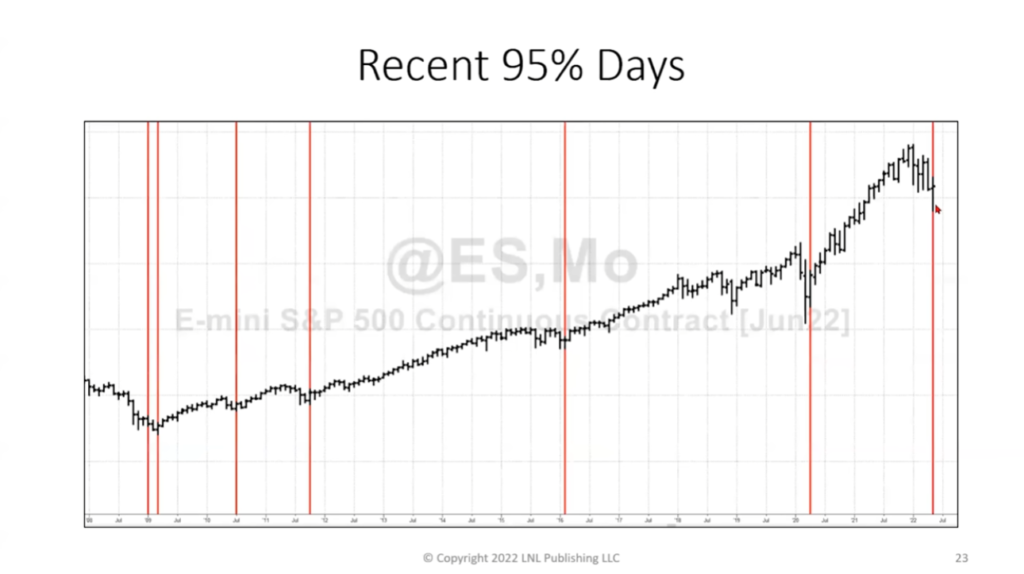
In addition to the panic selling, Larry points out that we’ve also had a “breadth thrust” up day. A breadth thrust day is one where the number of advancing issues on an exchange divided by the total number of issues is greater than 90%. Lowry’s Research has done a lot of work on the breadth thrust indicator and points out that every bear market low and bull market beginning has ended with multiple 90% breadth thrust up days.
Larry points out that we’ve actually seen a 95% up day.
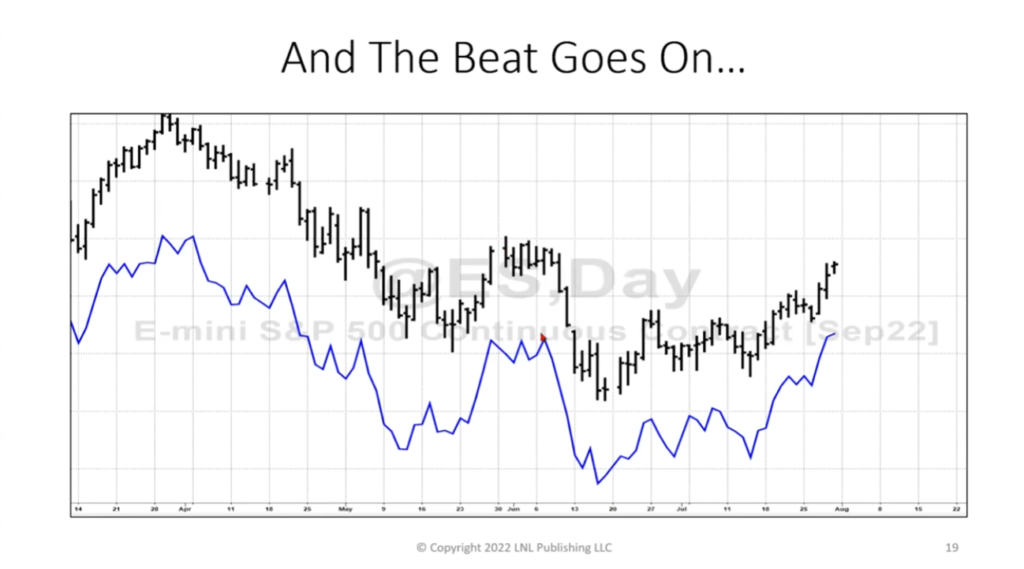
Larry also points out that the advance-decline line has made a new high and often price follows this breadth indicator, as it did at the recent highs.
Larry’s entire presentation can be accessed on Youtube.com.