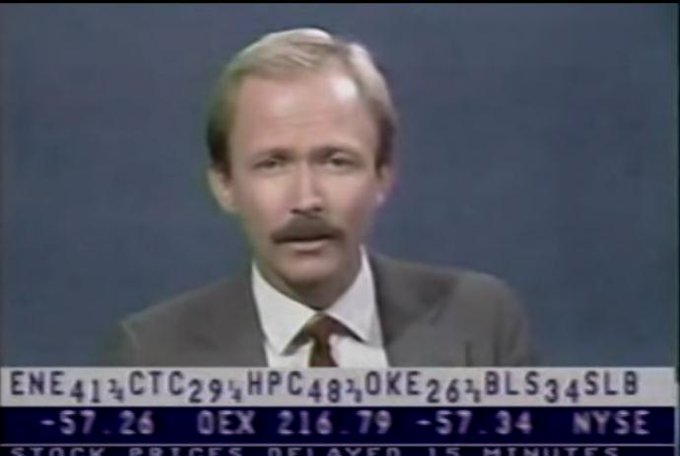
I’m in the money management business because I was home from school on October 19, 1987, and was watching the Financial News Network (precursor to CNBC). October 19th marked the day of a 25-standard-deviation stock market event. The Dow Jones Industrial Average fell 22% in one day. I watched Bill Griffith, pale and shocked, nearly puke. It was fascinating.
I was hooked.
So it’s no surprise the 1987 top is burned into my mind. The market was expensive, interest rates had been rising, the dollar was strong. Everything said the market should decline, but it had continued rising. Then, the trendline broke, a downward sloping wedge formed, it broke higher, sucking in even more money. But then it rolled over.
I only point this out right now because the hottest fund for the past five years, Cathie Wood’s ARK Innovation ETF is showing a similar pattern. Same huge run, same trend break, same downward sloping wedge, same break higher, sucking in late buyers.
But before you sell all your ARK, there’s a plot twist. The 1987 chart I posted above didn’t actually start the final decline.
It was a head-fake before the final, crazy rally.
That rally lasted through the summer and topped out in August of that year. Incredibly, the Dow printed almost the exact same pattern as it had in April. But this time, the bottom dropped out.
Bubbles can go on longer than anyone can ever imagine. So, although technology stocks and ARKK have been hit, it might not be the end quite yet. Stay on your toes and prepare for big moves one way or the other. Keep your eye on the 200 day moving averages. Stay nimble.


